Introduction
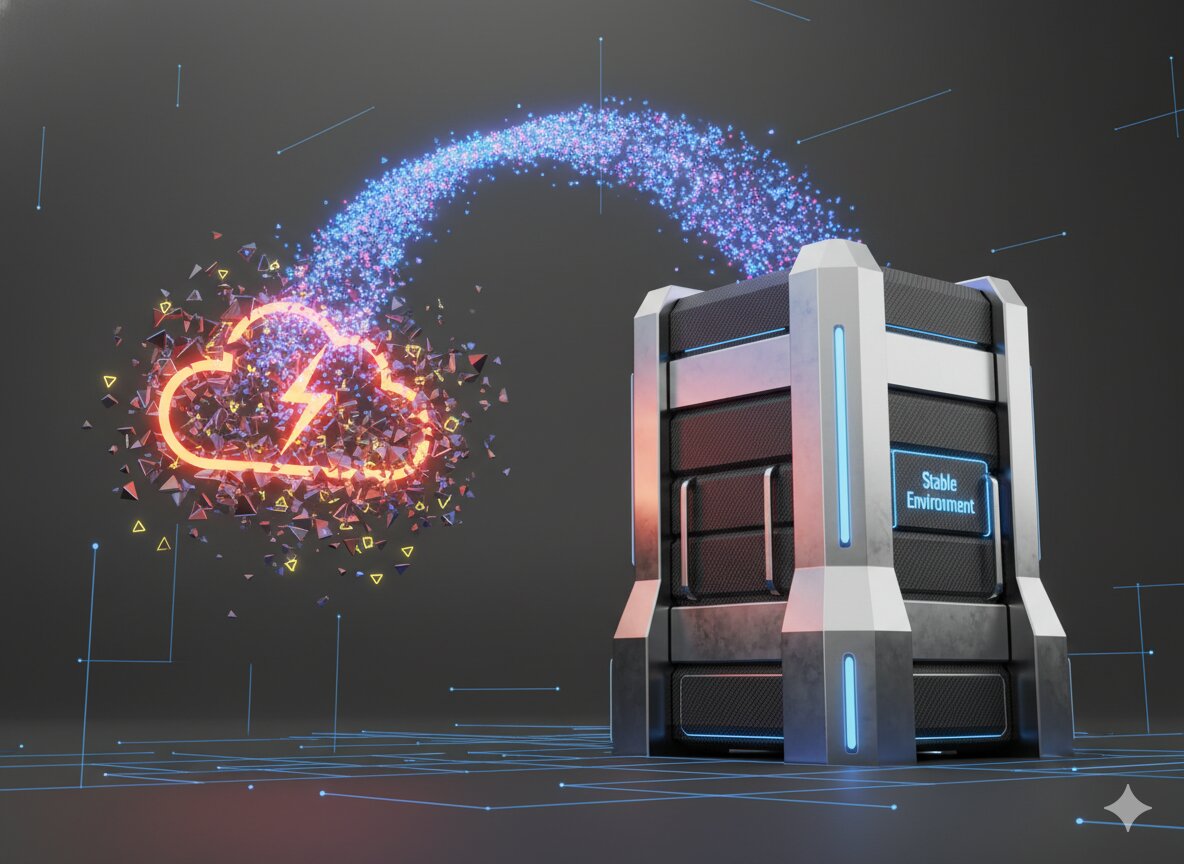
The system design panel looks straight at you and sets the ultimate core infrastructure trap: "Our global microservices platform generates over 100 terabytes of telemetry data, metrics, and application logs every day. During a major system outage, thousands of distributed containers start screaming error codes simultaneously, creating an unmanageable data spike that completely crashes our central logging database. Engineers cannot load troubleshooting dashboards, search queries are taking minutes to resolve, and we are losing millions in revenue because we cannot find the root cause of the breakdown. How do you re-architect our global logging and telemetry pipeline to handle massive ingestion spikes while keeping search response times under 2 seconds?"
Your heart skips a beat. This is where average candidates fall into the "Monolithic Indexing" trap.
They offer naive fixes: "I would just spin up a bigger Elasticsearch cluster," or "I would write all the logs straight to a large relational database table with standard indices."
Stop building fragile, monolithic storage pools. Forcing high-throughput, raw text log writes directly into heavy search engine indexes during a system outage is an architectural anti-pattern that guarantees total database thread-exhaustion. In elite FAANG PM and TPM infrastructure loops, panels are not evaluating your ability to set up basic dashboards. They are checking your mastery of Asynchronous Log Buffering, Distributed Write-Ahead Log Sharding, Log Parsing/Structured Tokenization, Columnar Storage Formats, and Tiered Cold/Hot Lifecycle Data Management.
To pass this core technical infrastructure round, you need a highly resilient, scalable data pipeline. You need the TRACE-STREAM framework.
The Core Framework: The "TRACE-STREAM" Method
Elite infrastructure platform leaders do not write raw text logs directly to disk. They decouple data collection completely from active indexing, transformation, and search infrastructure using an asynchronous streaming pattern.
                  [ Distributed Container Containers ]
                                   │
                                   ▼ (Millions of Logs / Sec)
       ┌────────────────────────────────────────────────────────┐
       │             T-IMESTAMPED ASYNC COLLECTORS              │
       │  * Lightweight edge agents (FluentBit) buffer logs     │
       └────────────────────────────┬───────────────────────────┘
                                    │
                                    ▼
       ┌────────────────────────────────────────────────────────┐
       │             R-ESILIENT STREAM STORAGE BUS              │
       │  * Asynchronously pushes raw byte lines into Kafka     │
       └────────────────────────────┬───────────────────────────┘
                                    │
                                    ▼
       ┌────────────────────────────────────────────────────────┐
       │             A-UTOMATED TOKENIZATION & PARSING          │
       │  * Stream processors parse JSON strings into schemas   │
       └────────────────────────────┬───────────────────────────┘
                                    │
                                    ▼
       ┌────────────────────────────────────────────────────────┐
       │             C-OLUMNAR COMPRESSION STORAGE              │
       │  * Groups logs by patterns; writes to Parquet/ClickHouse│
       └────────────────────────────┬───────────────────────────┘
                                    │
                  ┌─────────────────┴─────────────────┐
                  ▼ (Hot Tier Lookups)                ▼ (Cold Tier Archive)
       ┌─────────────────────┐             ┌─────────────────────┐
       │  E-XPRESS CACHE DB  │             │  E-CONOMICAL STORE  │
       │  In-Memory / SSD    │             │  Object Storage S3  │
       │  Sub-2s Query Speeds│             │  Long-term Audit    │
       └─────────────────────┘             └─────────────────────┘
1. T-imestamped Asynchronous Edge Collection
Never let an active application container wait for a logging server to accept its data. Offload telemetry chunks instantly to local background workers.
- The Strategy: Deploy ultra-lightweight, non-blocking background collection agents (like Fluent Bit or OpenTelemetry Collector) on every application host. These agents consume logs from local memory ring buffers and batch them efficiently before network transmission.
- Interview Script: "To ensure that a massive surge in system errors never blocks our core application performance, we will completely decouple logging execution from the primary compute threads. We will deploy local OpenTelemetry collection agents on every server node. These background workers pull system logs straight from asynchronous memory buffers, batching raw strings locally before transmission to eliminate application network penalties entirely."
2. R-esilient Write-Ahead Stream Storage Bus
Protect your downstream search engines from being completely crushed by massive traffic anomalies or alert spikes.
- The Strategy: Funnel all raw telemetry batches asynchronously into an intermediate distributed message broker cluster (like Apache Kafka or Redpanda). This acts as a massive shock-absorber buffer, allowing the storage systems to pull data at their own optimal pace.
- Interview Script: "We cannot let a huge spike in outage alerts hit our primary database cluster directly. We will place a highly distributed Apache Kafka cluster in front of our storage layer to serve as a shock absorber. Inbound tracking batches are written instantly to disk as a raw append-only sequence across sharded partitions, allowing downstream indexing consumers to pull data safely at their own manageable pace."
3. A-utomated Tokenization & Structured Parsing
Convert heavy, disorganized free-text strings into highly structured, lean data shapes to minimize memory usage and unlock fast filtering.
- The Strategy: Use decoupled stream processing engines (like Logstash or custom Apache Flink workers) to parse unstructured strings into structured JSON metrics, appending explicit metadata tags like
service_id,environment, andtrace_id. - Interview Script: "Raw free-text strings are incredibly inefficient to store and search. Our downstream stream processing tier pulls messages from Kafka and instantly parses them into structured formats. The engine strips out variable parameters, matches messages to known log patterns, and appends explicit metadata tags—such as trace IDs and service identifiers—transforming messy strings into compact, queryable attributes."
4. C-olumnar Data Compression and Formatting
Optimize database storage layout to dramatically reduce hardware footprints while accelerating metric calculation loops.
- The Strategy: Store structured logs inside highly parallelized columnar database management systems (like ClickHouse or Apache Parquet format arrays on object storage). Columnar organization compresses repeated pattern strings by up to 10x and speeds up analytical scans.
- Interview Script: "Traditional row-oriented relational databases fail under heavy analytics loads because they force the system to read entire rows off the disk just to filter a single column. We will store our parsed log fields inside a columnar engine like ClickHouse. Because telemetry logs repeat the same structural patterns line after line, columnar compression easily shrinks our physical storage size by 90% while allowing our search queries to skip irrelevant blocks entirely."
5. E-xpress vs. E-conomical Tiered Data Lifecycles
Balance lightning-fast incident response needs against long-term enterprise regulatory audit costs by grouping storage spaces by age profiles.
- The Strategy: Implement a two-tiered data lifecycle. Maintain a hot/warm tier inside high-performance SSD clusters for the last 7 days of tracking metrics to fuel sub-2s query dashboards, while moving older historical files asynchronously into cheap object storage (like Amazon S3) as a cold archival tier.
- Interview Script: "We will optimize infrastructure costs by implementing a tiered data architecture. We route the newest 7 days of logs into our hot tier using SSD-backed ClickHouse clusters, guaranteeing sub-2-second dashboard query responses for our on-call incident engineers. Once logs pass that 7-day window, a background automation job moves them into a cold tier on low-cost Amazon S3 object storage, preserving archival logs for compliance audits without inflating operational budgets."
The Comparison: Bad vs. Good
Bad Answer (Monolithic Relational Logging)Good Answer (TRACE-STREAM Framework)"I will write an engineering script to insert every log message straight into a central SQL database table, put a standard index on the text field, and buy a larger server if the database slows down during an outage.""I will deploy an asynchronous TRACE-STREAM architecture utilizing lightweight edge collectors, a decoupled Apache Kafka buffering tier, columnar ClickHouse storage formats, and tiered data lifecycle arrays.""If our monitoring dashboards stop loading when a major container failure happens, we will tell engineers to stop logging so many errors or delete our older tracking tables to clear up disk space.""I will isolate our core transaction engines from telemetry storms using Kafka partitions, parse raw text into structured metadata schemas via stream workers, and partition data into hot SSD and cold object tiers."
The Pitch/Transition
Building an enterprise-grade observability architecture requires far more than just connecting pre-built visualization tools—it demands a deep understanding of asynchronous network patterns, write-heavy database engines, and storage cost dynamics. The TRACE-STREAM framework is just the beginning.
In high-concurrency FAANG platform interviews, system design panels will intentionally stress-test your ability to handle data scaling emergencies without exceeding tight cost limits. Don't leave your performance to luck.
Arm yourself with the exact infrastructure design patterns, real-world case studies, and systemic vocabularies used by elite engineering directors across the tech industry:
- Secure your product strategy, metric lifecycle, and data execution rounds using the comprehensive PM Prep Guide.
- Dominate your system design, high-volume streaming scale, and backend infrastructure loops with the tactical TPM Prep Kit.
FAQs
Q: Why use a columnar database like ClickHouse instead of an indexed text engine like Elasticsearch for logs?
A: Elasticsearch builds massive, inverted index files for every single word block, which requires massive memory overhead and slows down write speeds under heavy loads. Columnar databases store identical column fields consecutively on disk, allowing near-instant indexing speeds, superior data compression, and faster analytical filtering across billions of log rows.
Q: How does the system handle "poison pill" logs that fail structured schema validation parsing?
A: When log parsing processors hit a corrupted or malformed log line that breaks validation rules, they automatically intercept the entry, wrap it with a processing failure tag, and push it into a dedicated Dead Letter Queue (DLQ) topic in Kafka. This prevents broken formats from locking up the primary stream worker pipeline while allowing engineers to debug the ingestion error safely.
Q: What is the mechanical difference between tracing, metrics, and logging in a telemetry pipeline?
A: Metrics are structured, aggregated time-series numeric values (e.g., CPU utilization percentage) used for alerting. Logs are discrete text lines generated by a running container describing a specific event. Tracing maps the end-to-end network flight path of a single transaction request as it hops across multiple distributed microservices using a shared transaction identifier ($CorrelationID$).


















.jpg)