The Interview Trap: The "Data Panic" Tailspin
The interviewer blindsides you with a sudden data crisis: "You are the Product Manager for a major global ridesharing app. On Tuesday morning, your executive dashboard shows that week-over-week (WoW) completed rides have suddenly dropped by 8% in your primary metropolitan market. The executive team is panicking, demanding immediate answers, and threatening to pause new feature rollouts. How do you isolate the root cause and resolve this drop?"
Most candidates tank this technical execution round by offering a chaotic, unorganized laundry list of guesses: "I would immediately check if the servers went down, then ask the engineering team if they deployed any buggy code last night, and maybe run a marketing promotion to boost the numbers back up." Stop. Jumping straight to solutions or listing random hypotheses signals to a FAANG interview panel that you lack a structured, repeatable analytical process. Senior product leaders and technical program directors don’t panic—they isolate variables systematically. They deploy an exhaustive root-cause engine to rule out data pipeline glitches, environmental factors, and upstream user journey breaks before touching a single line of code.
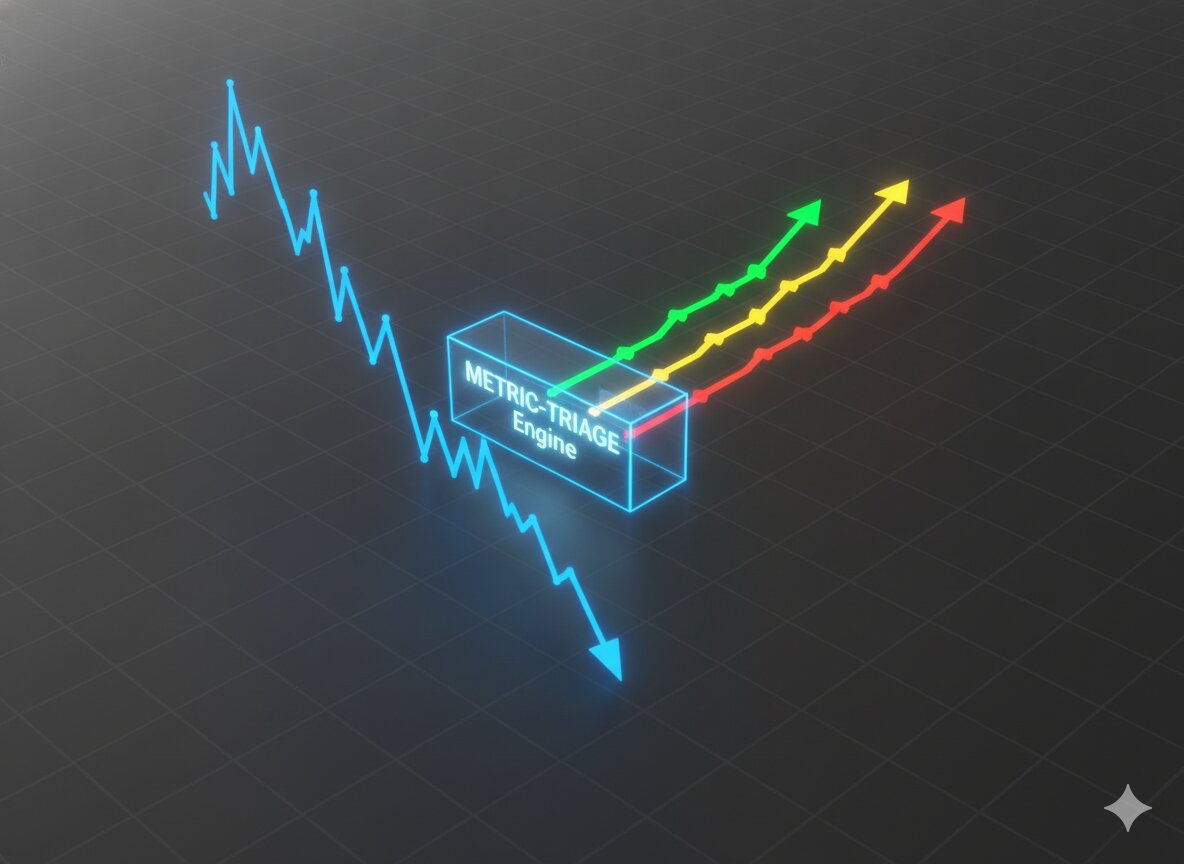
The Core Framework: The "METRIC-TRIAGE" Method
Elite PMs and TPMs treat a dropping metric exactly like an emergency room doctor treats a critical patient: they stabilize the data, isolate the specific anatomical break, and then execute a precise surgical intervention.
1. M-etric Definition and Data Integrity Validation
Before guessing why user behavior changed, ensure the data tracking itself isn't broken.
- The Strategy: Rule out instrumentation failures, logging bugs, and reporting latency anomalies first.
- The Script: "Before formulating hypotheses about user behavior, I must first validate the integrity of the data stream. I will verify with our Data Engineering squad that our event logging pipelines are healthy, that no tracking schemas were corrupted in a recent deployment, and that this 8% drop isn't simply an artifact of an incomplete data processing pipeline or reporting delay."
2. E-nvironmental and Macro Factor Assessment
Isolate the dropping metric from external global events that are entirely outside your product’s software ecosystem.
- The Strategy: Check for seasonality, major holidays, severe regional weather anomalies, macro-economic shifts, or massive competitor marketing campaigns.
- The Script: "Next, I need to separate product behavior from macro-environmental variables. Was there an unseasonal extreme weather event or a major transit strike in that specific metropolitan market? Is this a predictable holiday seasonality dip? Are our competitors running aggressive, subsidized pricing campaigns in that specific region?"
3. T-emporal and Velocity Analysis
Pinpoint the exact speed and pattern of the decline to determine whether you are dealing with a sudden system break or a slow, structural decay.
- The Strategy: Analyze whether the drop occurred as a sharp, instantaneous cliff or a gradual, compounding downward slope over several weeks.
- The Script: "I will analyze the velocity of the drop. Did the 8% decline happen instantly overnight on a specific day, or has it been compounding gradually over the last 14 days? An instantaneous cliff indicates a breaking technical deployment or infrastructure failure; a gradual slope suggests a shifting user sentiment or a progressive degradation in system performance."
4. R-egional and Segment Categorization
Slice the aggregate data by user demographics, technical platforms, and operational cohorts to isolate the specific infected variable.
- The Strategy: Break down the 8% aggregate drop into distinct sub-segments: iOS vs. Android, new users vs. power users, or specific geographic sub-regions.
- The Script: "I will segment the aggregate metric to find the specific pocket of failure. Is the 8% drop distributed evenly across all users, or is it heavily isolated to Android devices running a specific OS version? Is it localized to new sign-ups while our power-user retention remains completely flat?"
5. I-nbound Funnel Component Decomposition
Map out the exact user journey chronologically to find the exact drop-off step where the transaction funnel is leaking.
- The Strategy: Deconstruct the metric into its mathematical upstream components. For a ridesharing app,
Completed Rides = App Opens x Ride Searches x Ride Requests x Driver Matches x Completed Trips. - The Play: "A metric drop is always the mathematical result of an upstream conversion failure. By mapping out our user journey step-by-step, we discover that App Opens and Ride Searches are perfectly flat, but Ride Requests have plummeted by 22%. This instantly narrows our target surface area down to the specific screen where users select their ride options and view pricing."
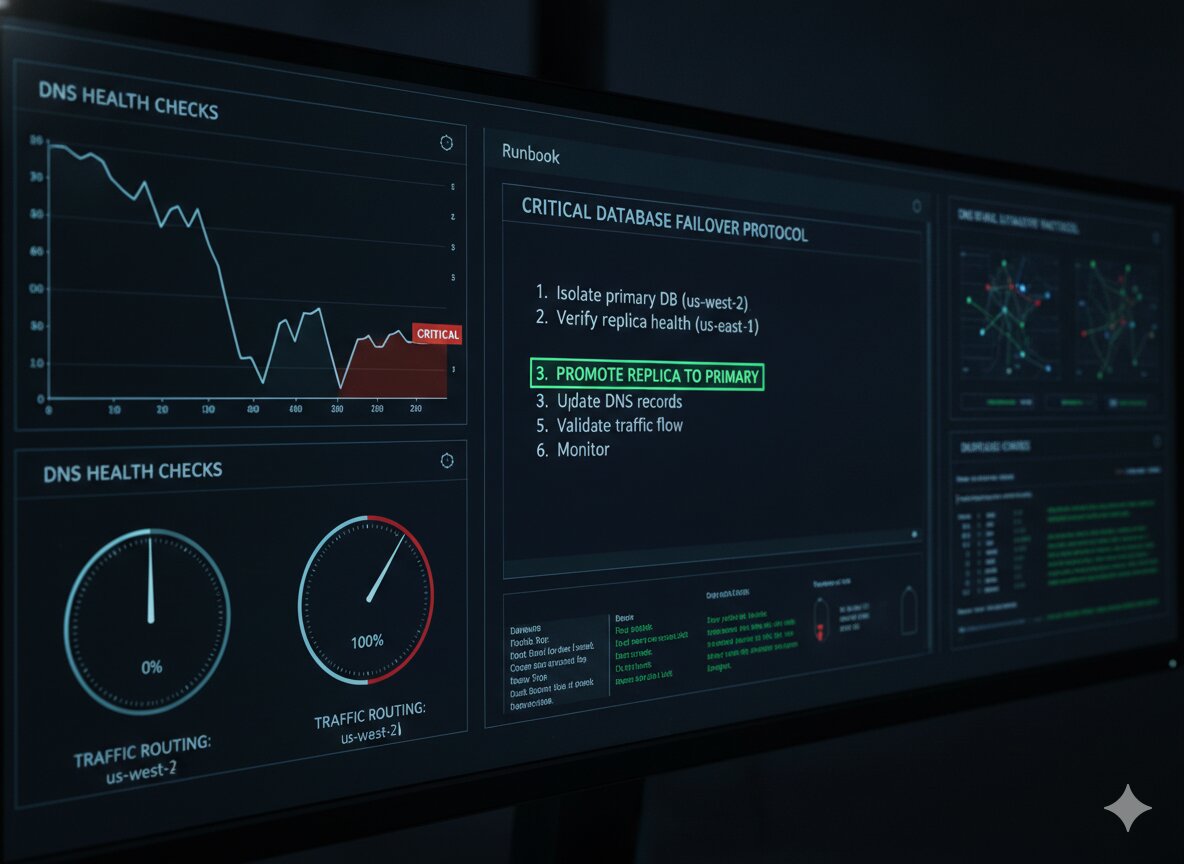
6. C-orrelative Engineering and Architecture Audit
Match the isolated funnel leak directly to internal system changes, release logs, and microservice dependencies.
- The Strategy: Audit recent service-level deployments, API changes, core database latencies, or third-party payment gateway performance metrics within the isolated window.
- The Play: "Now that the leak is isolated to the pricing screen, I cross-reference our release logs. We discover that a microservice deployment on Monday evening introduced an API latency spike in our localized currency conversion engine. This delay caused our pricing screen to timeout for 22% of users, silently forcing them to abandon the app."
The Comparison: Bad vs. Good
Bad Answer (Reactive Panic)Good Answer (METRIC-TRIAGE Framework)"I think it’s probably a bug, so I would tell the engineers to rollback the entire app release immediately to fix the numbers.""I will systematically validate our data integrity, rule out macro-seasonal noise, and segment the metric by platform and region before altering our code baseline.""I would brainstorm a list of potential reasons with my team and run a promotional discount code to incentivize users to come back.""I will deconstruct the metric into its upstream mathematical inputs to pinpoint the exact funnel step where conversion breaks."Focuses on guessing, immediate patching, and emotional assumptions.Focuses on methodical isolation, data segmentation, and systemic root-cause identification.
The Pitch: Move Beyond the Data Trap
Commanding a metric crisis with absolute technical precision separates junior feature shippers from elite platform leaders. If you crumble or start guessing when an interviewer throws a data anomaly at you, you will not survive a FAANG product loop.
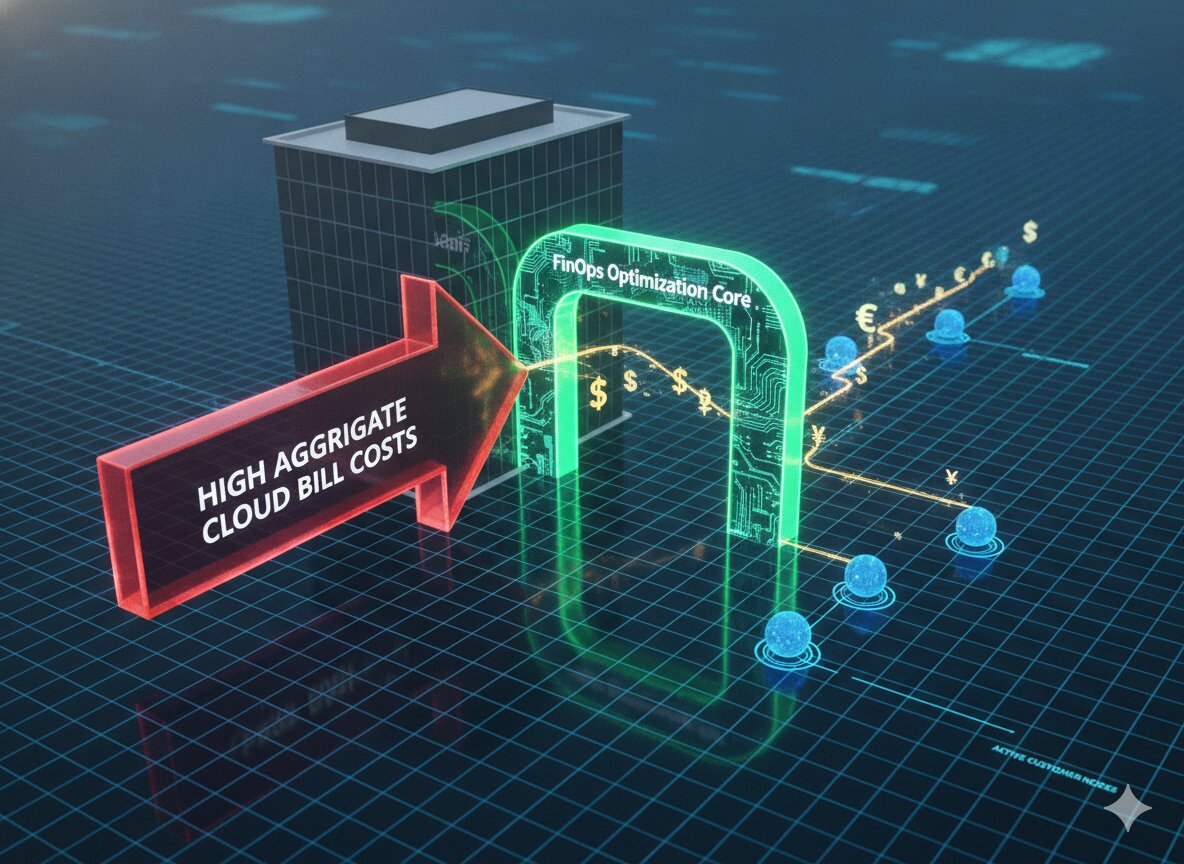
This framework is just the tip of the iceberg. Inside our comprehensive execution vaults, we break down every core product execution archetype—from marketplace liquidity crises to cloud system engagement drops—with absolute, step-by-step clarity.
👉 Master data execution and analytical strategy: PM Prep Guide
👉 Master infrastructure telemetry and system scalability loops: TPM Prep Kit
FAQs
Q1: What if the data engineering team confirms there is absolutely no data logging glitch?
A: Excellent. That means step one of your triage is complete, and you have successfully eliminated instrumentation error as a variable. You can now confidently inform the interviewer that because data integrity is verified, you are shifting 100% of your analytical focus to external macro variables and internal behavioral funnel segments.
Q2: How do I handle a situation where multiple metrics are dropping simultaneously?
A: Do not try to solve them all independently. Find the leading indicator. Use funnel decomposition to establish the chronological order of the metrics. For instance, if both "Add to Cart" and "Checkout Completed" are dropping, the core breakdown almost certainly resides at or before the "Add to Cart" stage. Fix the top of the funnel leak first.
Q3: Should I suggest a user research survey during a metric triage interview?
A: Only as a lagging validation mechanism for slow, gradual trends. For a sudden, acute 8% drop that happened overnight, user surveys are far too slow and qualitative. Lean heavily on systemic telemetry, engineering logs, and behavioral data segmentation to solve immediate, high-velocity crises.


.jpg)