The Data Trap
Most PMs look at "Vanity Metrics"—total users, total revenue, or total clicks. Stop. These are "Aggregate" numbers that hide the truth. If your revenue is up but your retention is down, you are dying a slow death. You must look at the Cohorts.
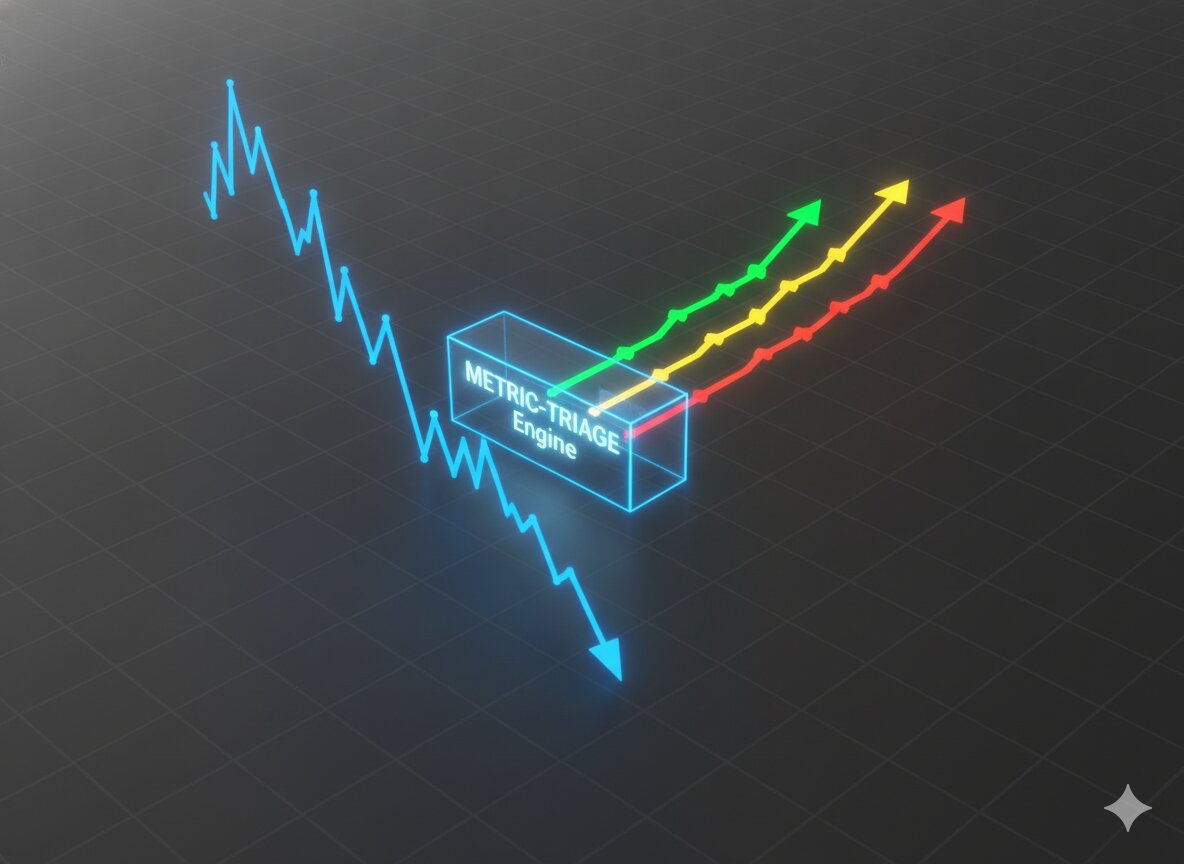
The Core Framework: The "3-D" Data Dive
1. Definition (The "Clean" Layer)
Before you run a single SQL query, you must define exactly what you are measuring.
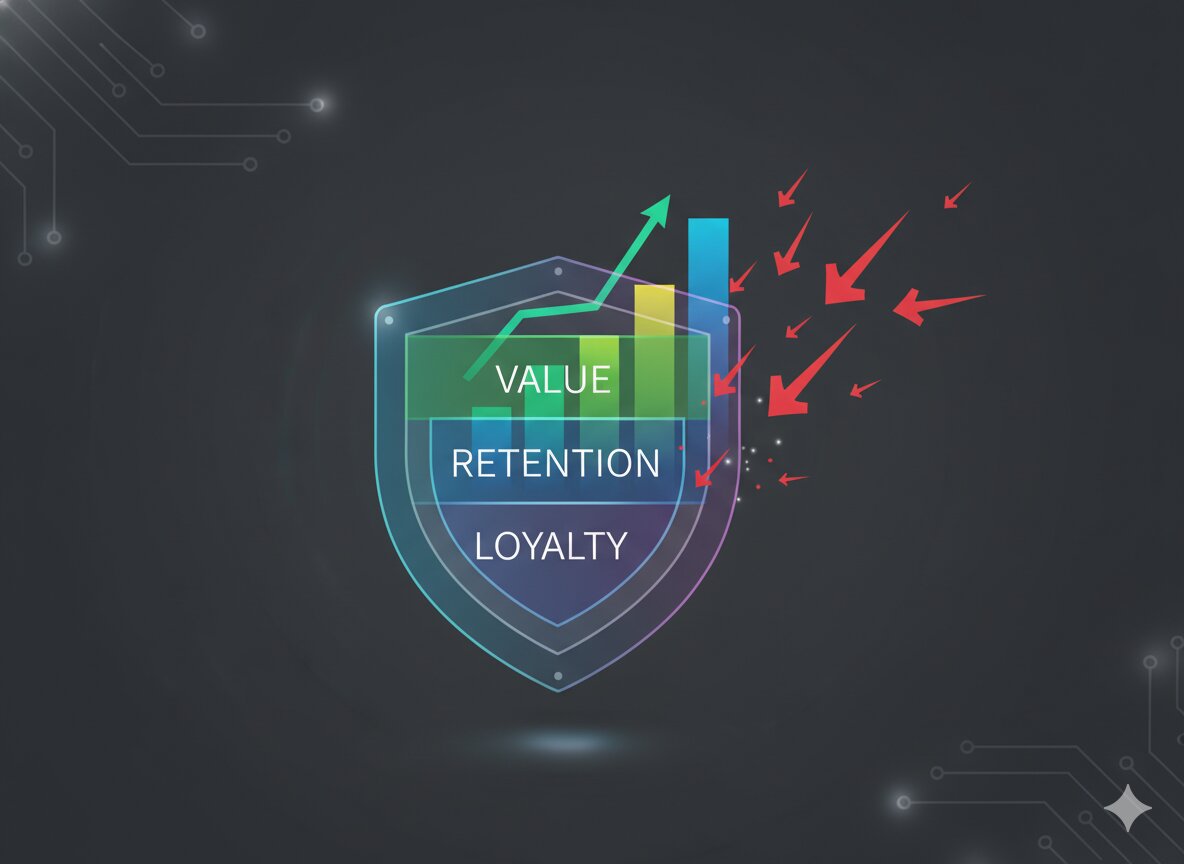
- The Strategy: Define the "Success Event."
- The Soundbite: "I don't just look at 'Retention'; I look at 'Value-Retention.' I define a 'Retained User' as someone who has completed at least three 'Core Actions' in their first 7 days. If they just log in and leave, they aren't 'Retained'; they are 'Zombies'."
2. Distribution (The "Spread" Layer)
Don't settle for "Averages." Averages lie.
- The Tactics: Look at the P90 and P99 (the extremes).
- The Soundbite: "The 'Average Session Time' is 5 minutes, but my SQL drill-down shows a bi-modal distribution. Half our users spend 30 seconds (they are lost), and half spend 15 minutes (they are power users). We don't have a 'mid-level' user; we have a 'polarization' problem."
3. Discovery (The "Why" Layer)
This is where you find the "Leading Indicators."
- The Tactics: Run a "Correlation vs. Causation" analysis.
- The Soundbite: "I ran a cohort analysis on our top 10% of users. The common denominator isn't their location or their age; it's that they all used 'Feature X' in their first 48 hours. Our roadmap should focus entirely on driving more users to 'Feature X' immediately after sign-up."
The "Intuition-Led" PM (Guesswork)The "Data-Led" PM (Precision)"I feel like users want a Dark Mode.""SQL shows 70% of users are active at night."Asks: "What is our conversion rate?"Asks: "What is the conversion rate for Cohort A vs B?"Relies on a Data Analyst for every report.Pulls their own SQL and builds their own Dashboards.
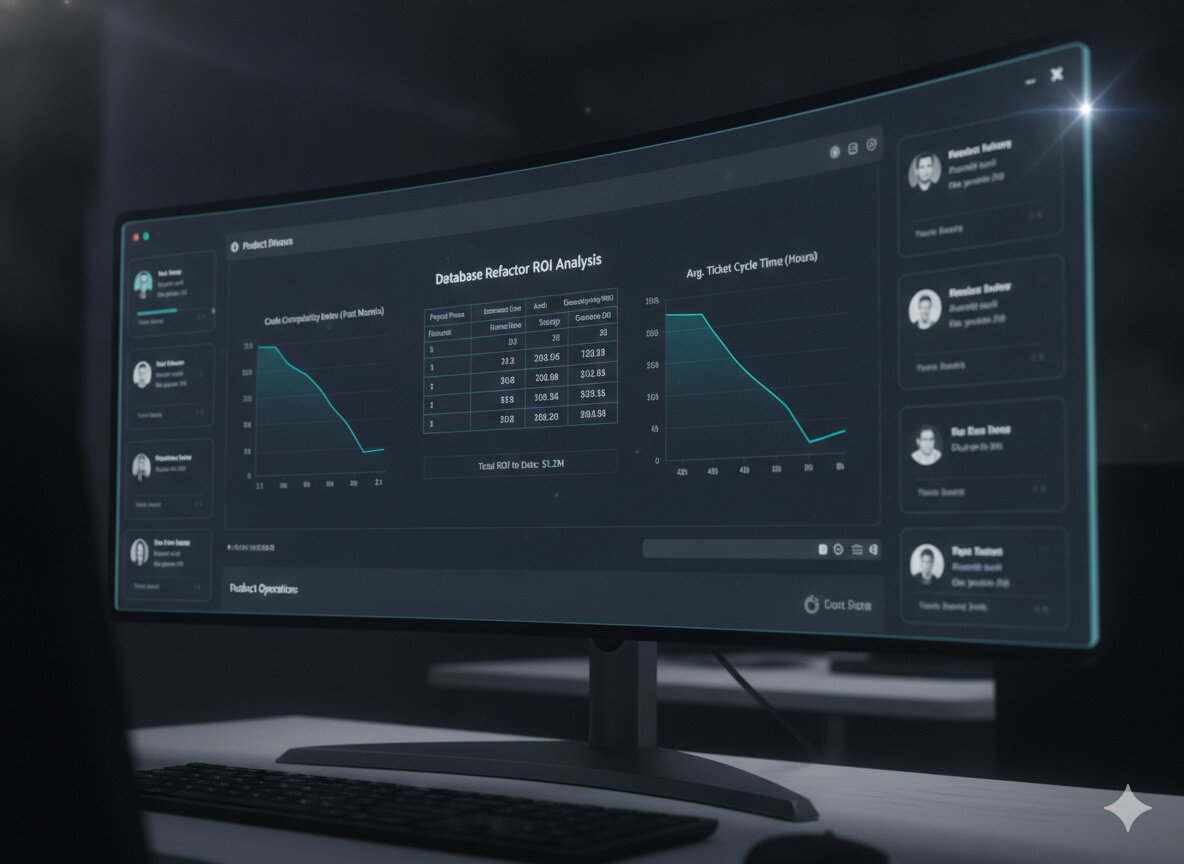
Turn Numbers into Narrative
Data is just noise until you turn it into a Story. To lead a product, you need to prove that you can use data to make hard decisions—like killing a "Favorite" feature that the numbers prove is useless.
Our kits provide "SQL for PMs Cheat-Sheets" and "Metric-Modeling Templates" used by data-driven teams at Netflix and Amazon.
- For PMs: Master the art of data-driven roadmapping with the PM Prep Guide.
- For TPMs: Design the telemetry and logging systems to fuel these insights with the TPM Prep Kit.
FAQs
Q: Do I really need to learn SQL?
A: Yes. In 2026, a PM who can't write a JOIN or a GROUP BY is like a pilot who can't read the instrument panel. It’s about Speed. If you have to wait 2 days for an analyst, your competitor has already out-iterated you.
Q: What is a "North Star Metric"?
A: It is the one metric that best captures the core value your product delivers to customers. (e.g., Airbnb = "Nights Booked," not "Users Logged In").
Q: How do I handle "Bad Data"?
A: "Garbage In, Garbage Out." Your first job as a PM is to audit your tracking. If your events are firing twice or missing parameters, your strategy is based on fiction.